*Interim dividends - declared and distributed during the years.
2012-13
2013-14
2014-15
2015-16*
2016-17*
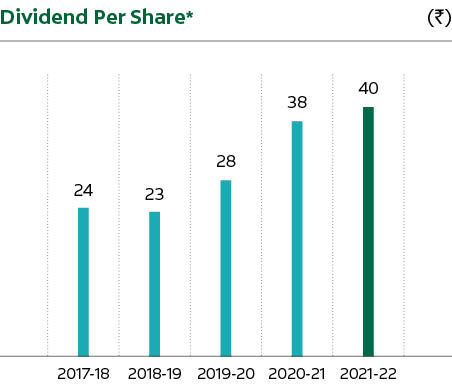
2017-18*
2018-19*
2019-20*
2020-21*
2021-22*
A. Operating Results
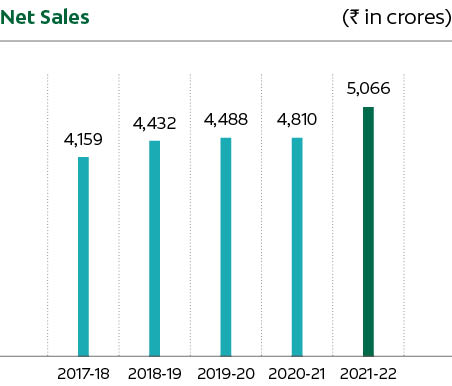
Sales
3,244,51
3,757,38
4,211,20
4,318,98
4,489,85
4,299,89
4,432,44
4,487,57
4,810,48
5,066,46
Other Operating Revenue and Other Income
129,63
84,25
60,34
69,64
71,47
66,00
67,65
86,76
61,09
59,59
Net Profit After Tax
496,75
539,87
558,98
581,17
577,43
673,37
775,57
816,47
1,035,39
1,078,32
Total Comprehensive Income**
-
-
-
579,98
572,26
674,45
775,67
800,94
1,038,63
1,082,99
Cash Profits
540,45
590,62
634,00
691,39
705,50
830,96
934,83
998,88
1,221,13
1,260,29
B. Financial Position
Net Fixed Assets#
437,46
736,62
943,66
1,092,25
1,305,70
1,332,74
1,400,65
1,206,64
1,212,24
1,087,30
Investments
47,12
37,13
37,13
31,16
31,16
31,16
31,15
18,62
18,61
0
Other Assets/(Liabilities) (Net)
5,01
(173,89)
(210,47)
(92,37)
(63,06)
160,71
14,95
253,16
(64,99)
647,38
TOTAL ASSETS
489,59
599,88
770,32
1,031,04
1,273,80
1,524,61
1,446,75
1,594,16
1,165,86
1,734,67
Share Capital***
13,60
13,60
13,60
27,20
27,20
27,20
27,20
27,20
27,20
27,20
Reserves and Surplus
475,99
586,28
756,72
1,003,84
1,246,60
1,497,41
1,419,55
1,566,96
1,138,66
1,707,48
SHAREHOLDERS’ FUNDS
489,59
599,88
770,32
1,031,04
1,273,80
1,524,61
1,446,75
1,594,16
1,165,86
1,734,68
Loan Funds
-
-
-
-
-
-
-
-
-
TOTAL CAPITAL EMPLOYED
489,59
599,88
770,32
1,031,04
1,273,80
1,524,61
1,446,75
1,594,16
1,165,86
1,734,68
C. Equity Share Data
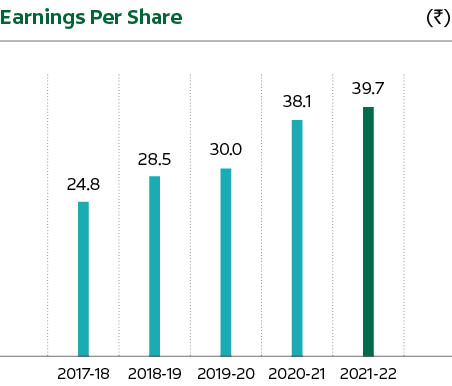
Earnings Per Share (₹) ***
36.53
39.7
41.1
21.37
21.23
24.76
28.52
30.02
38.07
39.65
Dividend Per Share (₹) ***
28
27
24
10
10
24
23
28
38
40
Number of Shares (in Lakhs)
13,60
13,60
13,60
27,20
27,20
27,20
27,20
27,20
27,20
27,20
Number of Shareholders (in ‘000s)
1,29
1,32
1,35
1,81
1,76
1,69
1,76
2,14
2,29
3,08
# Including Capital Advances.
* The figures reported for financial year 2015-16 onwards are Ind AS compliant.
** Total Comprehensive Income is required to be reported under Ind AS from financial year 2015-16 onwards and hence not reported for earlier years which are IGAAP compliant.
*** Issue of bonus shares in the ratio 1:1 during financial year 2015-16. Consequently number of shares has increased from 13,60 Lakhs to 27,20 Lakhs that is reflected in Earnings Per Share and Dividend Per Share for the year.
Previous year’s figures have been re-grouped to conform with current year’s presentation, wherever applicable.


 Smiles Ignite Minds – Our Innovation